Índice
- The economic cycle and the rise of raw material prices
- Deindustrialization is a fact
- Venezuela: The highest annualized hyperinflation in the history of Latin America
- The excessive emission of money (without even printing it)
- Salaries: absolute destitution
- The Minimum Legal Income measured through the ‘implicit dollar’
- Corollary
- References
Few would deny that Venezuela is suffering from the worst crisis in its history. For the fifth consecutive year the country will record the highest inflation in the world (estimated at 24,571% for the period May 2017 to May 2018) (Nacional. 2018)). In May 2018, monthly inflation reached 110% while cumulative inflation for 2018 was around 1,995% (Nacional, 2018). This is the seventh consecutive month with hyperinflation and the country watches dumbfounded as prices rise on a daily basis.
Venezuela also boasts a double-digit fiscal deficit (for at least the sixth consecutive year), the highest country risk in the world, has its lowest international reserves of the last 20 years (less than US $ 8,600 million) and is suffering from a tremendous shortage of essential goods and services (particularly food and medicine). The dollar exchange rate (which is used to set almost all prices) has increased by more than 3,500% so far in 2018, in the process completely disintegrating the purchasing power of the salaried workers (Sutherland, 2018).
In this present analysis, I intend to demonstrate that Bolivarian economic policy is far from being “socialist” or even ‘developmentalist’. What is evident, on the other hand, is a process of severe deindustrialization that favors an importer-financial caste that, by use of an incendiary discourse and aggressive popular clientelism, has drastically accelerated the downside of a cycle of capital accumulation based on the appropriation of hydrocarbon income. State policies have completely demolished workers’ incomes and have led to a dramatic process of lumpenization, plunging millions of people into an unfamiliar situation of extreme poverty. I will now attempt to explain how Venezuela has come to be in its current situation, the consequences of having descended to its present level, and the country’s immediate economic prospects.
The economic cycle and the rise of raw material prices
The economic cycle in Venezuela can be visualized most clearly and immediately through the inter-annual variations of the country’s GDP. The indicator, which in reality reflects the extreme variability of oil prices, shows the major changes in the rate of growth of the economy, together with the dramatic rises and falls that define the extreme volatility of capital accumulation. The country’s ‘Black Gold’ makes up around 95% of exports in boom years (2012) and close to 65% in years when the price of oil is ‘low’ (1998) (Central Bank of Venezuela), that is, when income is limited and hydrocarbons merely offer a rate of profit similar to standard industrial production.
The yearly increases in the pace of government spending and the spectacular expansion of imports now make oil prices five or six times higher than those at the beginning of the 2000s, appear “low”. In recent years we have witnessed a process of deindustrialization that has favored an intense wave of importing, and led to the subsidizing (through exchange rate overvaluation) 99.9% of imports such as liquid milk, cement or gasoline, in addition to workers (Chinese) brought in to build houses.
Deindustrialization is a fact
The growth of rentism persisted for a long period and during this time the problems that go hand in hand with sudden increases in oil income became more accentuated. Industry and agriculture were laid low with the sickle of an inconveniently overvalued exchange rate (Kornblihtt, 2016), imports became extremely cheap, and any attempt at industrial or agricultural production was discouraged. Initially, GDP experienced a notable rise (2004-2008), only to later fall below 1997 levels, a situation that at first glance might be considered incongruous, as in the high growth years (2004-2008) imports of industrial machinery and equipment (gross formation of fixed capital) quintupled (BCV).
The severity of the setback becomes evident if we analyze the production of automobiles in the light of recent figures. Between 2007 and 2015 production of vehicles plummeted by an impressive 89%, the 2015 figure being almost as low as that of 1962, when the automotive industry was formally created with a production of 10,000 vehicles. Since 2007, when 172,418 units were assembled, the automotive industry has experienced a dramatic decline, in 2015 falling to its worst level in 53 years, producing only 18,300 units (Deniz, 2016). According to data from the Automotive Chamber of Venezuela and the Venezuelan Autopart Federation, the assembly of vehicles in 2016 fell to 2,694 units, 83% less than in 2015 (FAVEMPA, 2016).
The drop in the sale of vehicles both imported and assembled in Venezuela, is a clear sign of the virtual disappearance of the automotive sector, the heart of national industry. Figure 1 shows the alarming nature of the situation.
Figure 1. Sale of Vehicles in Venezuela
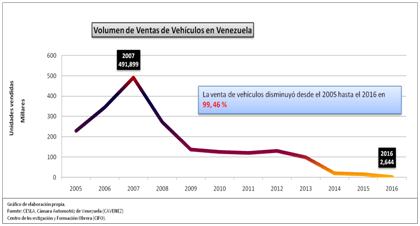
The sale of vehicles dropped by 99.46% between 2005 and 2016
Source: Centro de Investigación y Formación Obrera (CIFO-ALEM) data from CESLA and Chamber of Autoparts of Venezuela
The drastic deindustrialization combined with the fall in imports that, as previously explained, provoked a major reduction in the supply of goods and services, was a significant contributor to the decrease of available goods. This lack of goods led in turn to a situation in which the flood of newly created inorganic money was able to buy a decreasing number of products, thus making its effect on the general level of prices even more dramatic.
Venezuela: The highest annualized hyperinflation in the history of Latin America
“The Maduro government has not taken a single step to contain hyperinflation, and is still financing the public accounts deficit with inorganic money issued by the Venezuelan Central Bank.” (Pietro, 2018)
It is widely accepted that the country’s annualized inflation rate of 24,571% (according to the figures published by the National Assembly Finance Committee), is now the highest in the history of Latin America, surpassing the annualized inflation registered in the worst year of hyperinflation in Nicaragua (23.710%). May 2018 was also the country’s seventh consecutive month of hyperinflation, placing Venezuela fourth in the disreputable history of hyperinflation in Latin America as measured by duration. Although the threshold of 63 consecutive months of hyperinflation in Nicaragua may appear remote, the destruction experienced during the Venezuelan process seems much more serious than other longer lasting bouts of hyperinflation (Argentina: 11 months, Bolivia 18 months) (ProEconomía, 2018).
Another aspect of note is that while hyperinflation generally occurs without a dramatic drop in production, Venezuela’s hyperinflation has been accompanied by a serious collapse in the supply of goods, given that the economy has shrunk drastically each year since 2014. According to the IMF, the economy declined by 16.5 percent in 2016 alone (Looney, 2018), while our own calculations show that the accumulated fall in GDP for the period 2013 to 2018 could be as high as 45%: no recent hyperinflation has been accompanied by a similar destruction of wealth. Figure 2 presents a compilation of data that illustrates the hyperinflation cycle in Venezuela:
Figure 2. Hyperinflation in figures
National Assembly National Price Index
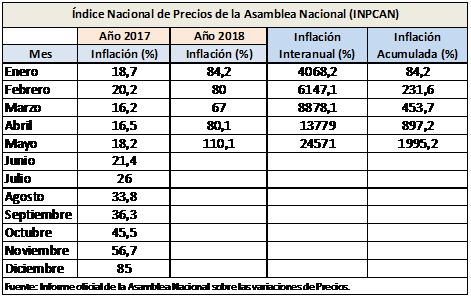
Source: Official report of the national Assembly on Price Variations
What is notable about the process is the increasing pace of inflation during 2017, from 18.7% in January until reaching the threshold of hyperinflation (56.7%) in November of that year. A drop in the pace of monthly inflation between December 2017 and March 2018 seemed offer the possibility of a lower figure by the middle of the year; however, the May 20th presidential elections brought with them a huge wasteful use of the dwindling public treasury, as political demands required an expansion of the money supply for proselytizing purposes. As a consequence, an additional issue of digital money added 110% to the May 2018 inflation rate, consequently increasing the accumulated inflation for the year to 1,995.2%. If the inflation rate for May (the highest in Venezuela’s history) were to be repeated for the next 11 months, the result would be annualized inflation of 735,583%. If the first monthly hyperinflation of 56.7%, recorded in November 2017, were to be repeated as a monthly average, annualized inflation would be 21.919%, a scenario that the government might well see as “desirable”.
According to Steve Hanke, specialist in hyperinflation processes around the world, annualized hyperinflation in Venezuela (June 2017 to June 2018) reached the chilling figure of 38,169% (Hanke, 2018). The figure was arrived at by analyzing the variations in the parallel exchange rate, specifically the Air TM indicator. The rate of inflation seems extremely high, but in these cases price changes are very difficult to measure, especially given the economic information blackout on the part of government institutions, which refuse to publish statistics.
The excessive emission of money (without even printing it)
It should be noted, however, that according to the criteria used here, the excessive emission of inorganic money cannot be considered as the sole root of hyperinflation, although it is essential for its development. It would seem to be the gasoline that feeds the fire of the inflationary spiral. In previous paragraphs it has been shown that the fall in the supply of goods, due to the causes mentioned above, constitutes an important factor in the dizzying increase in prices.
That said, specific data is available on the history of the money supply in Venezuela, supplied courtesy of the ineffable BCV. According to its own data, the BCV has increased the Monetary Base (MB) by an incredible 18 million percent between 1999 and 2018. The BCV increased the MB by 1,737% in 2017 alone, in the middle of a full economic contraction, which as might be expected translated into a corresponding increase in prices. Annual inflation in 2017 reached 2,616%, according to the National Assembly, somewhat higher than the growth of the MB.
If we track the Monetary Base between 2016 and June 2018, we can see that it increased by 16,347%, growth that little by little has been reflected in the country’s hyperinflationary process. This type of irrational issuing of money would put any economy into meltdown, and the present monetization of the deficit, intended to close the budgetary and para-fiscal breech, is at the heart of Venezuela’s unparalleled economic destruction.
Figure 3: Expansion of the Monetary Base (MB) (1999-2018) in Venezuela
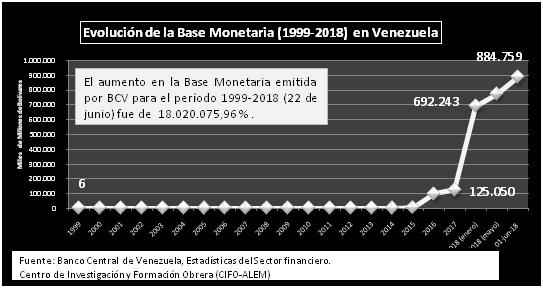
The increase in the Monetary base issued by the Venezuelan Central Bank for the period 1999-2018 (22 June) was 18,020,075.96%
Source: Central Bank of Venezuela: Financial sector statistics. Elaboration: Centro de Investigación y Formación Obrera (CIFO-ALEM)
The figure corresponding to the so-called M2 is available for almost all Latin American economies up to 2017. M2 is the total amount of cash and current account balances (M1), plus savings accounts, money market funds and other deposits. Broadly speaking, M2 is a concept that includes money that is not totally liquid, but can be converted quickly into cash. Figure 4 compares the growth of M2 in a number of Latin American economies, and it can be seen that in Venezuela the growth of M2 is much higher, something most governments try to avoid.
Figure 4: Evolution of M2 in a number of Latin American countries
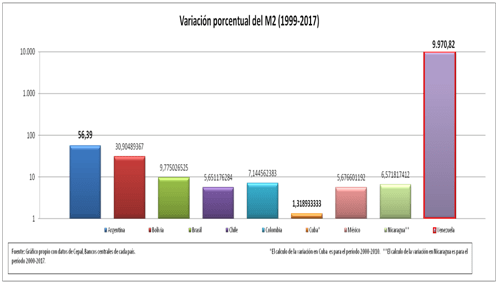
Percentage variation in M2 (1999-2017)
Source: CIFO with information from ECLAC and Central Banks of individual countries
A novelty of Venezuelan hyperinflation is that it will be the first in history to combine a drastic fall in production with a severe shortage of cash; for those who suffer day to day life in Venezuela, it is quite common not to have the small amounts of cash needed to pay for services such as taxis etc. As usual, the government came up with a novel idea to explain the shortage of cash: that it has been “induced”, i.e. that the cash had been “kidnapped” by Brazilians and Colombians at the border, and that this is part of a conspiracy to harm the national economy (‘economic war’). A look at the official issue of paper money and coins seems to indicate otherwise.
Figure 5: Paper money and coins in circulation in relation to the MB (2008-2018)
Ratio of paper money and coins issued to the Monetary base
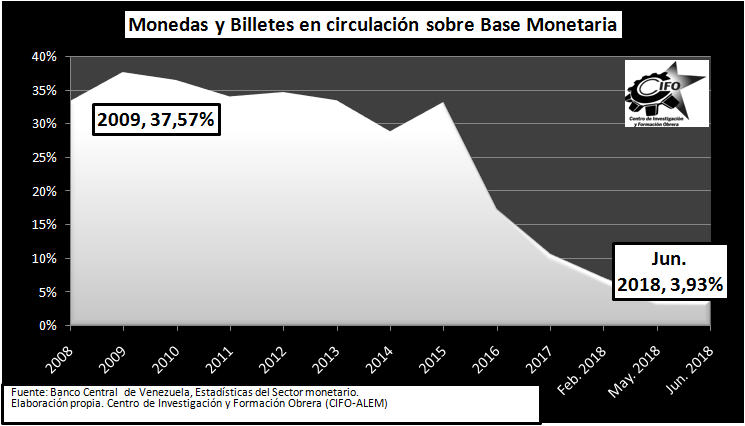
Source: Centro de Investigación y Formación Obrera CIFO-ALEM) with data from Central Bank of Venezuela Monetary Sector Statistics
What is quite evident is that the amount of bills and coins in circulation is about nine times lower than it was in 2009, the second year of the monetary reconversion. The conclusion is that the amount of cash presently in circulation is clearly insufficient. Complicating the situation is a major monetary mismatch: when the dollar in the parallel market is trading at Bs.3,500,000 and 40% of bills are printed in denominations of Bs.100.
Salaries: absolute destitution
In summary, it is clear that the present situation in Venezuela is not related to the failure of economic measures based on the texts of Marx or actions undertaken during the Russian Revolution. In reality, the Bolivarian process is simply a variation of the economic policies stemming from ‘oil rentism’ that were first implemented during the first social-democratic government of Carlos Andrés Pérez (1974-1979). The ideological component of the situation added to anti-imperialist and anti-business discourses confuses the majority of analysts, who study the Presidents’ speeches rather than their specific policies.
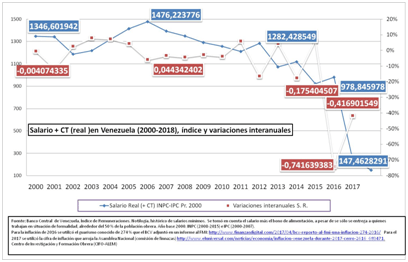
Figure 6 reveals the direct result of plundering oil income through currency overvaluation and the emission of inorganic currency used to sustain anarchic expenditure on a client network. The graph reflects a fall of 85% (2016 to June 2018) in the Minimum Legal Income (salary plus food bonus) that the Venezuelan working class receives. Never before has wage destruction been so profound and inexorable. Salaries are so low that in many cases they do not even cover the cost of transportation to the office. The number of people leaving their jobs is massive, and the exodus of Venezuelans looking for work in other parts of the world already reaches around 3 million. The only hope for many is to receive some sort of monetary transfer from abroad.
Figure 6: Real salary plus food bonus (real) to June 2018. Index and annual variations
On the 20th of June 2018, President Nicolás Maduro decreed both the year’s fourth minimum wage increase, putting it at Bs.3,000,000 , and an increase in the food bonus to Bs.2,196,000. Taken as a whole, the so-called ‘legal minimum income’ (LMI) amounts to Bs. 5,196,000 representing an increase of 103% (Ecoanalítica, 2018). If we compare the latest minimum legal income with that of 2015, we can see that the government has increased the amount by more than 31 thousand percent in that time, using an inept policy of monetary illusion, with which it hopes to make people believe that salaries are constantly rising in order to “protect” them from the economic war, even though the increases do not actually represent increases in purchasing power.
If we measure the variations in the LMI in US $ by using data related to the parallel dollar (Dolar Today), we can see that in 2001 (with a floating exchange rate) the minimum income in Venezuela was among the highest in Latin America, at around US $400 per month. With a fully controlled exchange rate (2004) the minimum legal income reached US $ 315 and until 2011 still exceeded US $ 250 per month. As of June 2018, however, the same indicator shows an exchange of just US $ 1.53 per month, a fall of 97% compared to the not so distant year of 2013, the first of the Maduro Presidency. Figure 9 illustrates this painful and regrettable crash.
Figure 7: The legal minimum income in US $ as quoted on the parallel market
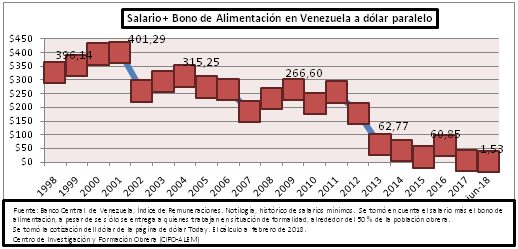
Source: Centro de Investigación y Formación Obrera (CIFO-ALEM) using data of Central Bank of Venezuela. Remuneration index. Historical minimum wage. The minimum wage and the food bonus was taken into account despite the fact that these only apply to those working in formal situations: i.e. 50% of the working population. Dollar exchange rate taken from DolaToday Web Page. Calculations as of February 2018
The Minimum Legal Income measured through the ‘implicit dollar’
Many national and international supporters of the government have commented that the real wage indicator, based on the parallel dollar, is erroneous and biased. With some merit, they argue that the methodology is precarious and the figures consequently suffer from a lack of scientific rigor.
Another indicator, this time developed with official data, is the so-called ‘implicit dollar’, which measures the connection between monetary liquidity (M2) and international reserves (gold and foreign currency). The relationship was generally used to measure the unofficial exchange rate, until Web Pages opted for more informal measurements. The ’implicit dollar’ indicator shows the evolution of the foreign currency (US $) base of the Bolivar and serves as a way to measure the progress (to be generous) of the Minimum Legal Income in Venezuela in recent years. This indicator also reflects the reality of the painful devaluation of wages, behaving quite similarly to the one based on the parallel dollar. Figure 8 illustrates the 90% drop in the MLI (salary plus food bonus) that the Venezuelan working class has suffered in the period 2000-2018.
Figure 8 : The Minimum Legal Income in Venezuela in ‘Implicit’ US $
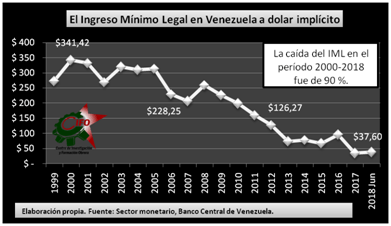
The drop in the MLI between 2000 and 2018 was 90%
Source: Centro de Investigación y Formación Obrera (CIFO-ALEM) Data from Central Bank of Venezuela Monetary Sector Statistics
It is important to note, however, that the MLI’s downward trend began prior to the advent of President Maduro. For example, from 2000 to 2012 the decrease in the MLI as measured by the ‘implied’ US $ was 62%, despite the fact that during that period the price of oil had multiplied by 10 and oil exports had quadrupled (Central Bank of Venezuela).
Corollary
In carrying out a rigorous analysis of the national process of capital accumulation in Venezuela, the global left should not mute its criticism or resort to outlandish defenses of the Venezuelan government in order to ‘not play into the hands of the right’. The left must criticize “progressive” governments with the same intelligence and keenness that it applies to openly anti-working class and right-wing regimes.
There is no reason for the international left to ignore the importance of the problems in ‘progressive’ countries, what it must do is to collaborate with proposals that can provide possible solutions to these afflictions; its job is not to use ‘chocarrera’ ideology (‘economic war’ or, ‘imperial conspiracy’ etc.) to conceal the gruesome economic results of governments they uncritically lionize.
The real commitment of the left must be to the truth, to facts and results that are concrete and obvious; loyalty is not about cronyism or support for governments that call on them to be part of a circus of flattery and decadence.
The commitment of the left must be to the working classes of countries suffering from conditions that demand immediate solutions. There can be no commitment to the defense of the bureaucrat who, bloated with millions of dollars, evades responsibility in the heartless and bloody destruction of several generations of workers who cannot even afford to have a family.
There are alternatives to the crisis, and the El Centro de Investigación y Formación Obrera (CIFO) will soon present them for the broadest constructive debate. All must fight to stop this rampant locomotive of a crisis.
References
Banking and Business (January 1, 2018). March 2, 2018, in http://www.bancaynegocios.com/perspectivas-economicas-de-venezuela-para-2018/
Central Bank of Venezuela. (s.f.). BCV. May 1, 2018, http://www.bcv.org.ve/
Central Bank of Venezuela. (s.f.). BCV October 15, 2016, www.bcv.gov.ve
Deniz, R. (January 26, 2016). America Económica. http://www.americaeconomica.com http://www.americaeconomica.com/venezuela/22356/automotriz-venezuela-retrocede.html
Dollar today. (March 19, 2016). https://dolartoday.com
Ecoanalítica. (June 21, 2018). Ecoanalitica: http://ecoanalitica.com/noticias/graficoespecial-aumento-de-salario-minimo-una-triste-realidad
FAVEMPA. (November 8, 2016). FAVEMPA Statistical Bulletin Summary of Vehicle Sales. January 5, 2017, in: // C: / Users / Manuel-Casa / Documents / data% 20economicos / Data% 20de% 20automoviles / Bolet% C3% ADn% 20Estad% C3% ADstico% 20No% 2061 % 202016% 20Summary% 20Sales% 20November% 202016.pdf
National Institute of Statistics (INE). (2017). www.ine.gov.ve. February 18, 2017, from http://www.ine.gov.ve/index.php?option=com_content&view=category&id=103&Itemid=40
Kornblihtt, J. (March 10 2016). Analysis of income in Venezuela. (M. Sutherland, Interviewer) Capital Federal, Buenos Aires, Argentina: ALEM.
Neuman, W., & Torres, P. (5 of 6 of 2015). NY Times. in http://www.nytimes.com/2015/05/06/universal/es/importadores-malversan-millones-en-venezuela-y-hunden-la-economia.html?_r=0
Pietro, H. (March 3, 2018). New York Times April 11, 2018, in https://www.nytimes.com/en/2018/03/03/opinion-prieto-hiperinflacion-venezuela/
ProEconomy. (June 11, 2018). in www.proeconomia.net/inflacion-venezuela/
Fortune Magazine. (January 25, 2018). Fortune. Retrieved on February 1, 2018, from http://fortune.com: http://fortune.com/2018/01/25/venezuela-inflation-imf-estimate/
Sutherland, M. (August 20, 2014). Aumento del 21.693,21 % en la importación de carne, caída del consumo y escasez de la misma in https://www.aporrea.org: https://www.aporrea.org/ddhh/a193540.html
Sutherland, M. (2016). Criticism of the economic policy of “21st century socialism”: private appropriation of oil rent, import policy and capital flight. Latin American Studies (38), 39-63.
Sutherland, M. (2018). The ruin of Socialism is not due to “socialism” or “revolution.” Nueva Sociedad (274), 142-152.
Sutherland, M. (2015). Progress or transition to socialism. Critical analysis of Bolivarian economic evolution. In the compilation, Transition, Transformation and Ruptures (pp. 171-208). Caracas: Safita.